In the "Major Revision (Differences Highlighted)" document, we use blue text to indicate additions (e.g., add words), purple for deletions (e.g., delete wordsdelete), and red for text replacements (e.g., new wordsoriginal wordsreplace). This convention is also applied to modifications within tables. For revised figures, changes are documented in the corresponding caption (e.g., new imgoriginal wordsreplace img).
A. Q1: A concrete measurement of the reduction in labeling effort for a small percentage of log instances (e.g. 2%).
We have revised the content related to Experiment RQ2 (Section IV, Paragraphs B, D2, and Figure 5) to investigate the performance variation of LogAction as the labeling effort increases from 0% to 5%, with increments of 0.5%. This analysis aims to assess whether LogAction can maintain its effectiveness under a small percentage of labeled log instances. Our findings indicate that LogAction achieves an F1 score exceeding 89.96% with a minimal labeling effort of only 0.5%.
Furthermore, on most datasets, LogAction attains optimal performance when labeling percentage reaches 2%. We emphasize is that the 2% labeling cost was set for fairness. The objective of LogAction is to balance labeling cost and performance, allowing the proportion of labels to be adjusted according to practical needs. This point is further discussed in the Threats to Validity section (Section IV, Paragraph E). Please refer to the revisions in Section IV, Paragraphs B, D2, E, and Figure 5.
B. Q2: The missing details
We have addressed the previously missing details in our revisions, including the hyperparameters, a discussion of the fixed-size log window, and the rationale underlying the two-step active learning process.
1) the settings of the hyperparameters: We have added a list of hyperparameters along with their descriptions in the Experimental section (Section IV, Paragraphs A and Table II).
Additionally, we provide a detailed explanation of the rationale behind our hyperparameter choices and analysis in the Threats to Validity section of the Experimental part (Section IV, Paragraph E).
2) a discussion of the fixed-size log window: Since other baselines employ a fixed-size log window approach when processing the BGL, Thunderbird, and Zookeeper datasets, LogAction also adopts a fixed-size log window to ensure fairness. This is discussed in the Threats to Validity section of the Experimental part (Section IV, Paragraph E).
Additionally, the experimental results of LogAction on the HDFS dataset (Section IV, Table III), which utilizes a variable-size log window to generate log sequences, also demonstrate effective performance.
3) the rationale behind the two-step active learning process: We provide a further explanation of the rationale behind the two-step active learning process in the Approach section (Section III, Paragraph C).
Additionally, we include ablation experiments on the two active learning sampling methods in the experimental section (Section IV, Paragraph D3 and Table IV). The results demonstrate that both sampling methods contribute to the improved performance of LogAction.
C. Q3: Other issues
Revisions addressing other review’s questions will be explained in the following three sections.
A. Q1: Hyperparameters of LSTM (Metareview Q2-1)
Consistent with Metareview Q2-1, we have added a list of hyperparameters and discussed them in the Threats to Validity section. Please refer to the revisions in Section IV, Paragraphs A, E, and Table II.
B. Q2: Overhead of the proposed approach
We have added experiments on the efficiency of the method in the Experimental section (Section IV, Paragraph D4, and Figure 7). It can be observed that the efficiency of LogAction is lower than that of DeepLog and comparable to MetaLog and ACLog. Overall, the efficiency of LogAction is acceptable. Please refer to the revisions in Section IV, Paragraph D4, and Figure 7.
C. Q3: Gap-bridging ability of encoder
We have included a comparison between the encoder of LogAction and baseline methods in addressing distribution discrepancies across different systems within the experimental section (Section IV, Paragraph D3, and Figure 6). Specifically, we employed the t-SNE dimensionality reduction technique to visualize the data distributions of log vectors after encoding. Notably, the encoder of LogAction demonstrates superior performance, as the encoded log vectors from various systems form the most tightly clustered groups. This highlights the outstanding gap-bridging capability of LogAction’s encoder. Please refer to the revisions in Section IV, Paragraph D3, and Figure 6.
A. Q1: Labels for encoder
We have added a description of the label sources used for training the encoder in the approach section (Section III, Paragraph A). During the LogAction process, the encoder is trained jointly with the downstream anomaly detection model, and the labels come from active learning processes. Please refer to the revisions in Section III, Paragraph A.
B. Q2: Splitting strategy
We have added details regarding the partitioning of the training and testing sets in the experimental section (Section IV, Paragraph A). To prevent data leakage, we strictly split the training and testing sets based on time, ensuring a certain time gap between them to avoid any data leakage. Please refer to the revisions in Section IV, Paragraph A.
C. Q3: 2% labeling cost (Metareview Q1)
Consistent with Metareview Q1, we investigated a concrete measurement of the reduction in labeling effort for a small percentage of logs. The method effectively balances labeling cost and performance, allowing for dynamic adjustment based on practical requirements. Please refer to the revisions in Section IV, Paragraphs B, D2, E, and Figure 5.
D. Q4: The labels used for MetaLog
We have added a description of the labels used for MetaLog in the experimental section (Section IV, Paragraph D1). We emphasize that MetaLog is trained using 1% of anomaly labels in target system. However, due to the rarity of anomalies, this 1% anomaly labels requires screening a vast number of normal logs, thereby increasing the labeling cost. Please refer to the revisions in Section IV, Paragraphs D1.
E. Q5: HDFS dataset
We have added experiments on the HDFS dataset in the experimental section (Section IV, Tables III and IV). The results demonstrate that the method maintains excellent per- formance on HDFS. Due to the addition of a new dataset, some comparative results related to \method have been recalculated and revised. Across the four log datasets, it achieves an average F1 score improvement of over 25.28% compared to existing methods. Please refer to the revisions in Section IV, Table III and IV.
F. Q6: Some typo
Several typos have been corrected. For example, in Section I, “code start problem” has been revised to “cold start problem.”
A. Q1: Ablation study of the sampling strategy (Metareview Q2-3)
Consistent with Metareview Q2-3, we have added ablation experiments on the two sampling strategies. Please refer to the revisions in Section IV, Paragraphs D3 and Table IV.
B. Q2: Fixed time window (Metareview Q2-2)
Consistent with Metareview Q2-2, we have added a dis- cussion on the fixed-time window in the Threats to Validity section of the experiments. Additionally, we have included experiments of the method on the HDFS dataset segmented using a variable-time window. Please refer to the revisions in Section IV, Paragraph E, and Table III.
C. Q3: Hyperparameters (Metareview Q2-1)
Consistent with Metareview Q2-1, we have added a list of hyperparameters and discussed them in the Threats to Validity section. Please refer to the revisions in Section IV, Paragraphs A, E, and Table II.
1. Hyperparameters of LSTM: The encoder's ability to generalize is driven by the contrastive learning framework, with the LSTM serving merely as a standard feature extractor. In our experiments, LSTM hyperparameters were intentionally fixed based on prior classical works (LogTransfer[1], DeepLog[2]) across all datasets. Below is the list of our hyperparameters:
2. Overhead of the proposed approach: We conducted an efficiency analysis experiment for LogAction in BGL and Zookeeper dataset, and below is the experiments results. The reported training and inference times include the processing time for encoding and anomaly detection for a single log sequence. It can be observed that the efficiency of LogAction is lower than that DeepLog and is comparable to MetaLog and LogTransfer.
3. Gap-bridging ability of encoder: The distribution differences between logs shown in Figure 6 of the paper provide a direct demonstration of the encoding’s gap-bridging ability. We further compared the gap-bridging ability of the encoding component and baseline methods (Bert-based encoder, LogTAD, MetaLog) using this approach, with the results available below.
a. Bert: The distribution of data points in Bert shows a relatively scattered pattern. Normal and anomalous points from both source and target domains are interspersed without clear separation, indicating limited ability to distinguish different log categories effectively.
b. LogTAD: In LogTAD, there is some improvement in the distribution compared to Bert. However, the clustering of points is still not very distinct. Source and target domain points, especially anomalous ones, do not form well - defined clusters, suggesting moderate performance in separating log types.
c. Metalog: Metalog presents a better - organized distribution. Data points start to form more discernible clusters. Normal points (both source and target) are relatively grouped, and anomalous points also show some clustering tendency, implying an enhanced capability to differentiate log categories.
d. LogAction: LogAction exhibits the most favorable distribution. Points are highly clustered, with clear separation between normal and anomalous log data from both source and target domains. A distinct boundary can be observed, demonstrating superior ability in distinguishing and clustering different log types.
Among these, LogAction’s encoder performs most prominently, as the encoded log vectors from different systems are the most tightly clustered.
4. Intuition behind sampling strategy: These two sampling methods select the most valuable samples for labeling based on the data distribution and the model’s uncertainty distribution, respectively. The intuitive assumption is that the log distribution follows a normal distribution. Although this assumption does not always hold, both sampling strategies have demonstrated effectiveness. Ablation studies on these sampling strategies, specifically energy-based sampling and uncertainty-based sampling (LogActionwe and LogActionwu), are presented below and confirm the effectiveness of both methods. If space permits, we will include these results in the paper.
1. Labels for encoder: During the LogAction process, the encoder is trained jointly with the downstream anomaly detection model, and the labels come from active learning processes. We will include this explanation in the paper.
2. Splitting strategy: To prevent data leakage, we strictly split the training and testing sets based on time, ensuring a certain time gap between them to avoid any data leakage.
3. 2 % labeling:
a. Regarding whether 2% of labeled data covers all log templates: the principle of active learning is that a small subset of informative samples can effectively substitute training on the entire dataset. In log data, such valuable samples may correspond to the same log templates or semantically similar log events, which are specific to the software system and cannot be adequately captured by merely identifying log templates but require active learning. Furthermore, randomly selecting 2% of logs does not achieve the same effectiveness as active learning. This is evidenced by the ablation study, where replacing active learning with random sampling (LogAction_wa) results in a significant performance decline. b. Regarding labeling costs: the 2% labeling ratio represents the optimal performance of LogAction, rather than a strict requirement. As shown in Figure 5, the model still performs well with 1% or less labeled data (0% in the BGL dataset). In practice, the labeling ratio can be adjusted according to the difficulty of human annotation to balance cost and accuracy. Notably, reducing the labeling effort from 100% to 2% also significantly decreases human labeling efforts. For example, this approach saves 34,300 labeling instances on the BGL dataset.
4. The labels used for MetaLog: We want to emphasize that MetaLog used 1% anomaly labels instead of 1% of all labels in its experiments. Since anomalies are rare, the cost of labeling anomaly data is very high (e.g., labeling 10 log sequences might get only one anomalous log sequence). In our experiments, we training MetaLog using 2% of all labels, where the number of anomaly labels was far less than 1%.
5. HDFS dataset: Due to space limitations, we did not include results on the HDFS dataset in the paper. We have provided experimental results on HDFS and Zookeeper below. If space permits, we will include these results in the paper.
1. Ablation study of the sampling strategy: We provide some experimental results in Review #440A 4, which demonstrate that both strategies play a crucial role. If space permits, we will include these results in the paper.
2. Fixed time window: Since other baselines (such as LogTransfer[1]) use fixed time windows when working with the three datasets (BGL, Thunderbird, Zookeeper), we also adopt fixed time window segmentation to ensure fairness in the experiments. The time window size is selected with reference to classic works such as DeepLog[2]. Additionally, the experimental results on the HDFS dataset, which utilizes a variable size to create log sequences, are available on the website.
3. Hyperparameters: We have listed the hyperparameters in Review #440A 1, and if space allows, we will include them in the main text.
Issues: Cold start problems and High labeling efforts in log-based anomaly
detection
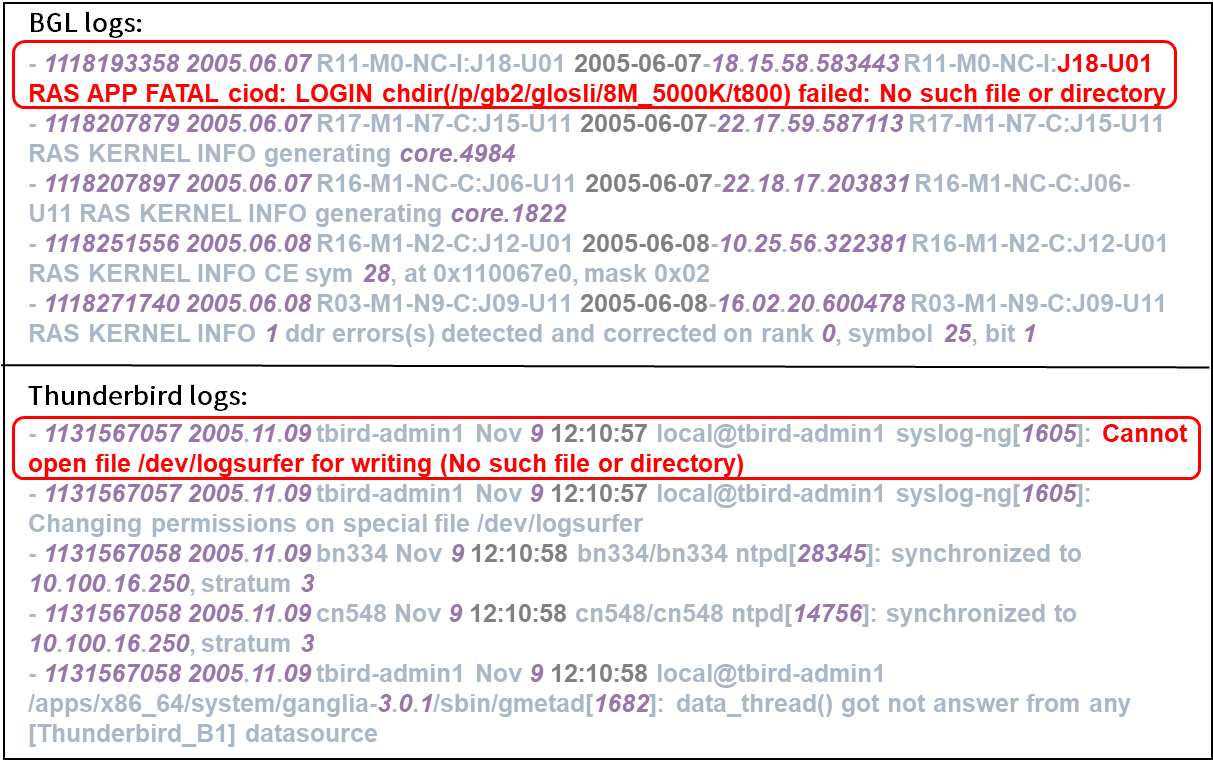
On one hand, during the initial deployment phase of software systems, it is impossible to
accumulate sufficient logs to train an effective anomaly detection model. On the other hand, the
massive and complex log data is difficult to accurately label, requiring substantial labeling
costs.
Key technologies: Incorporate Active learning and
Transfer learning
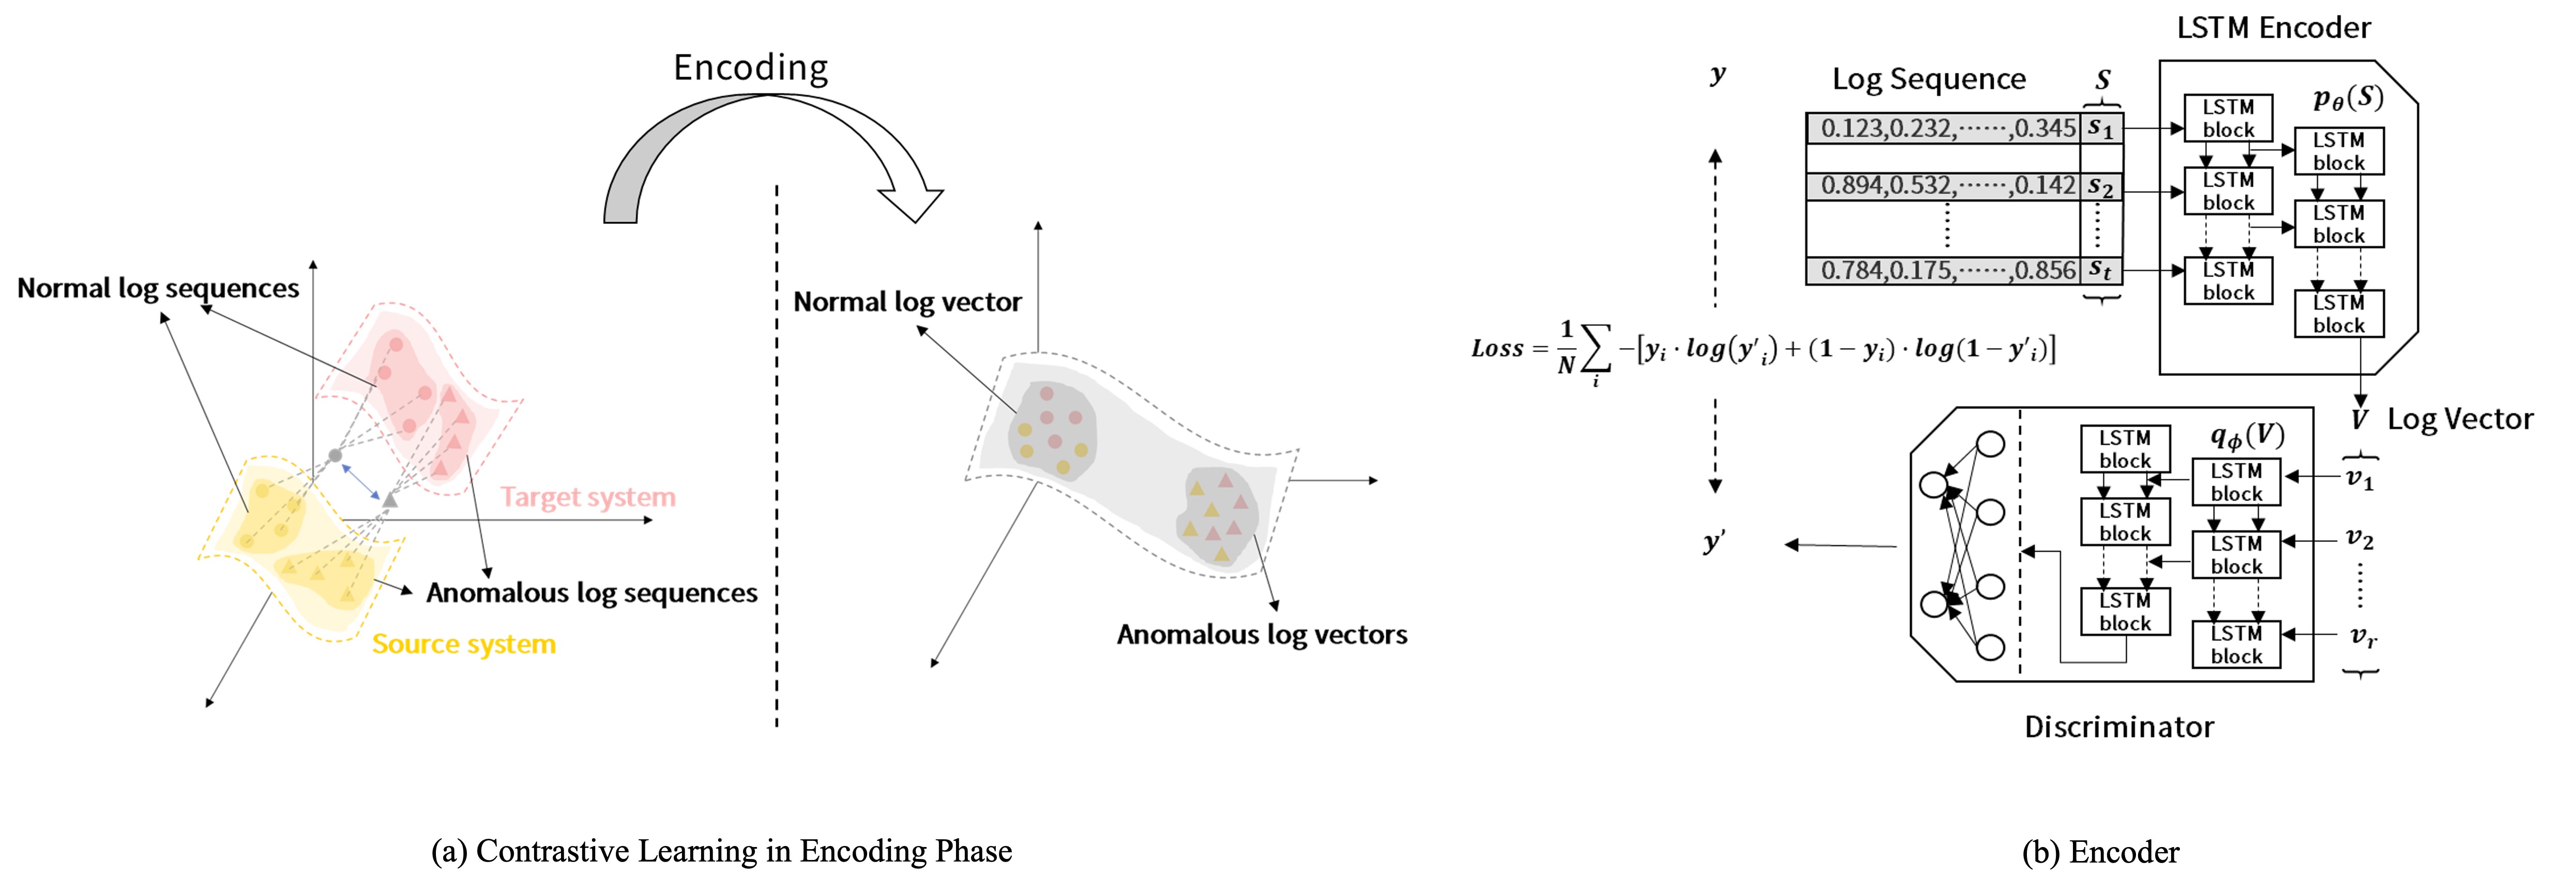
Transfer learning is employed to address the cold-start problem, LogAction training models on
mature systems and transferring them to new systems with insufficient data accumulation.
Meanwhile, active learning is utilized to reduce the amount of labels required during model
transfer process, thereby lowering manual labeling costs.
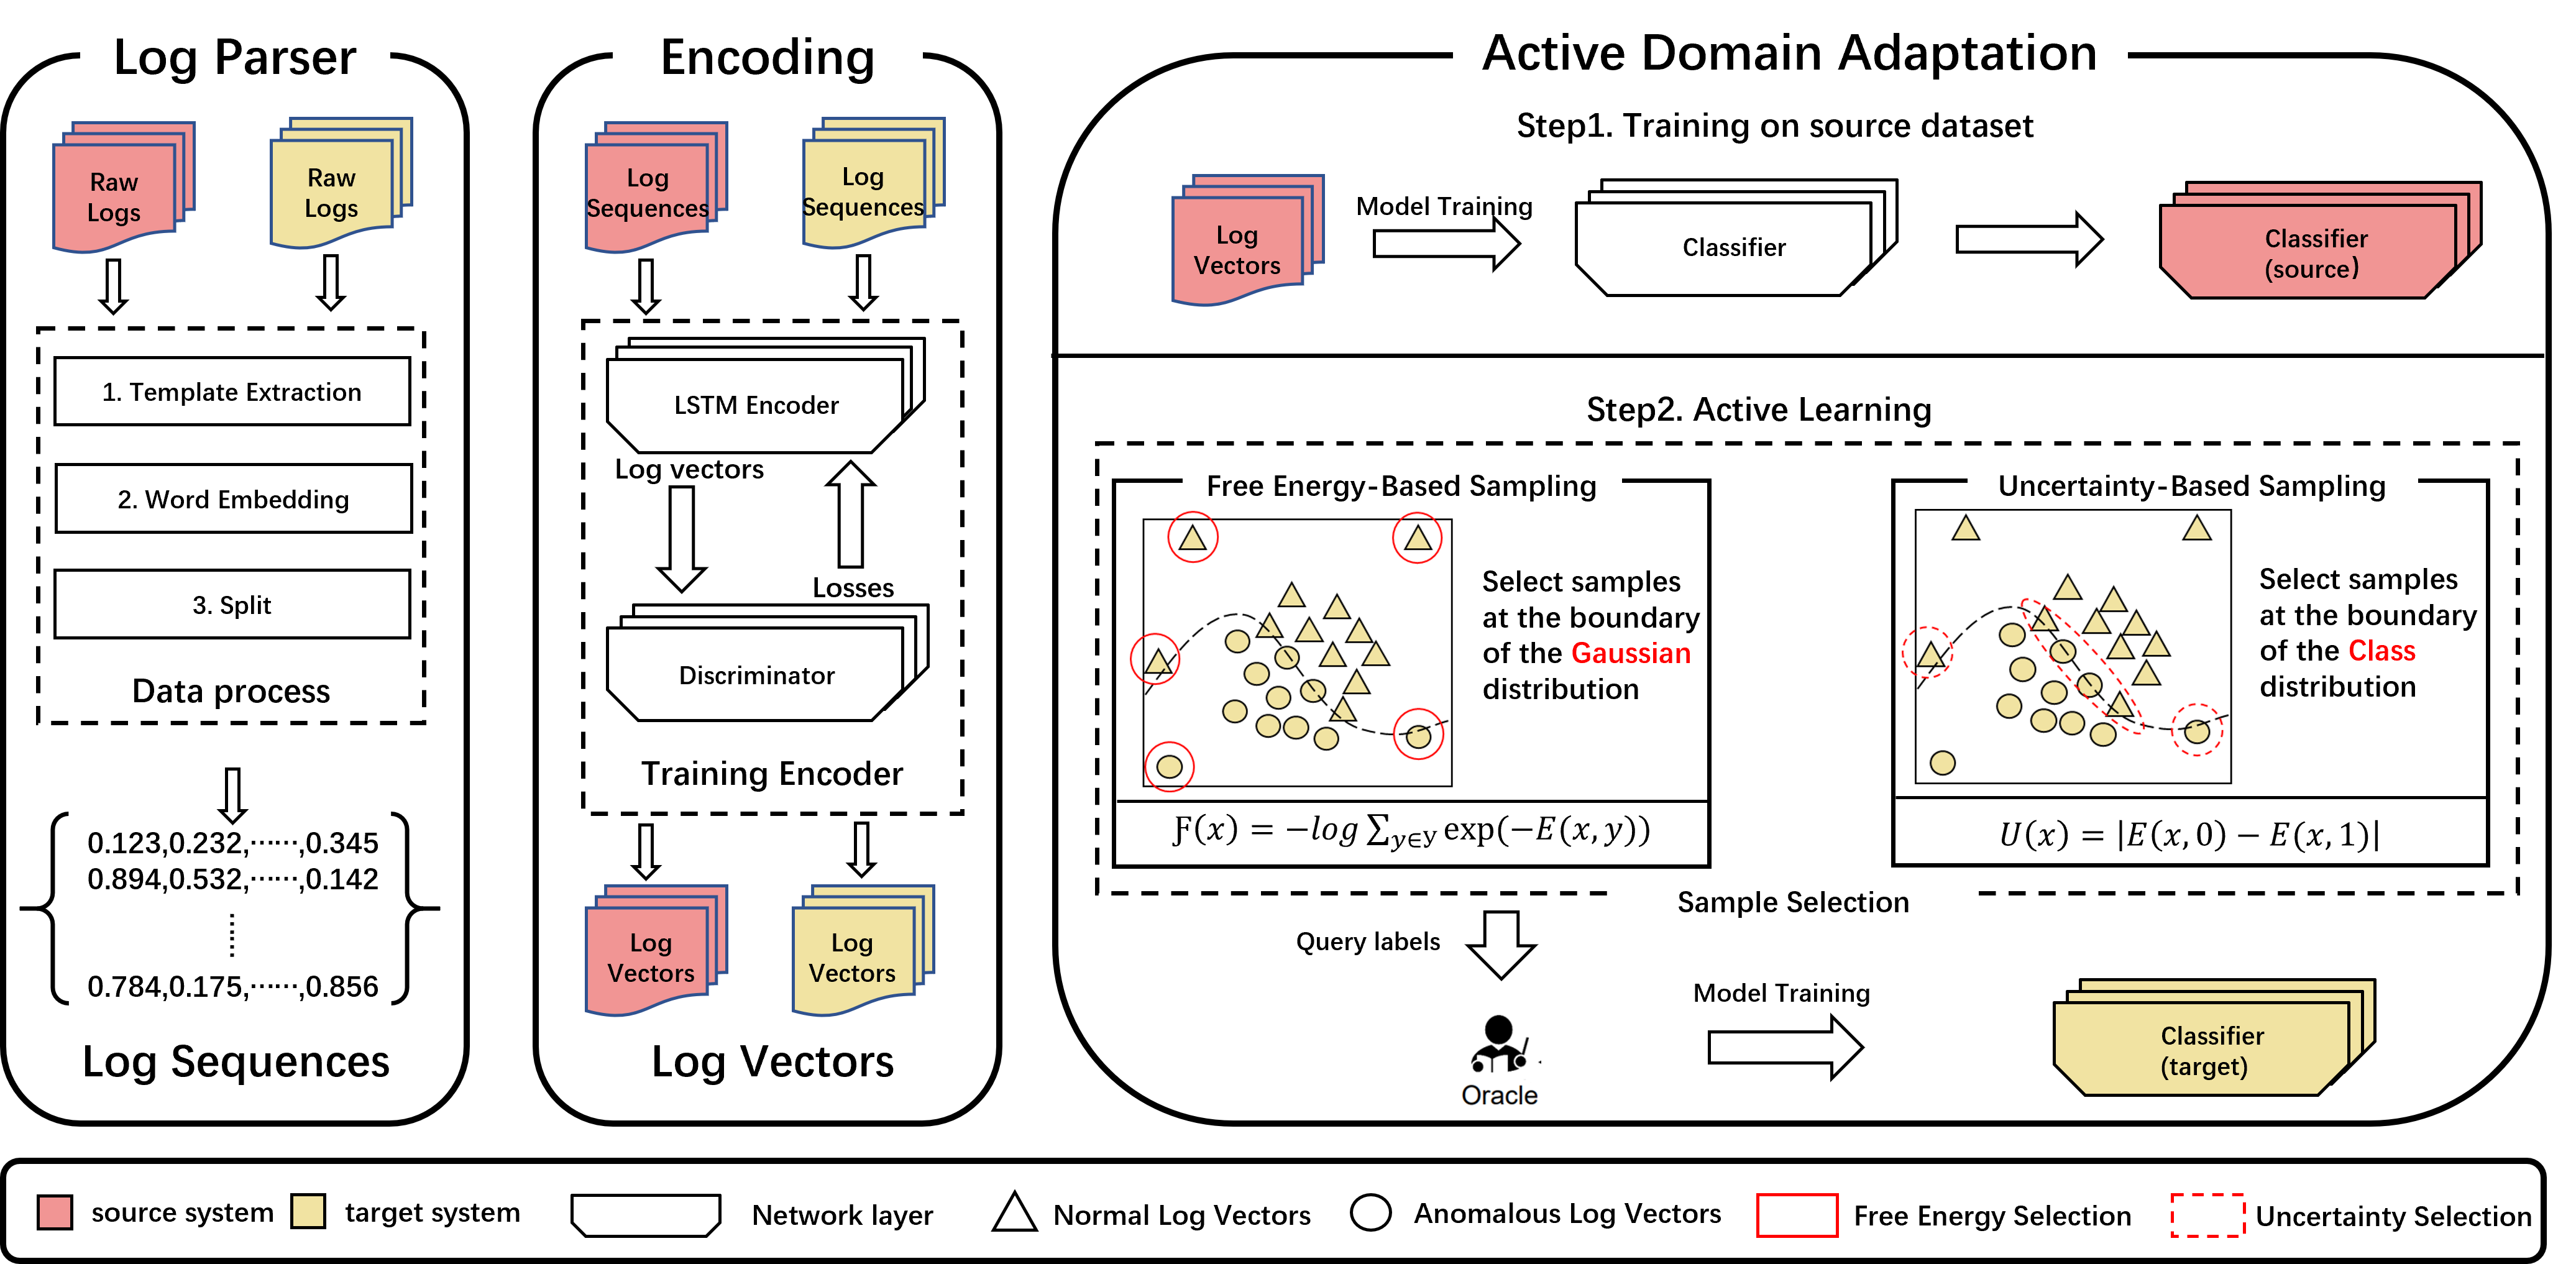
Our propose method: LogAction
As a result, we pose an idea that transfer learning and active learning should be combined
together to solve the label lacking problem. We define this scenario as consistent
cross-system anomaly detection (CCAD), that is, leveraging the features extracted from
abundant historical labeled logs of mature systems (source systems) to build anomaly detection
models for new systems (target systems) and consistently optimize the models with online human
labels on the target systems. In this paper, we focus on the CCAD scenario and aim to build a
high performance anomaly detection model without or with very few anomalous labels. We propose
LogAction, a consistent cross-system anomaly detection model via active domain
adaptation.
LogAction outperforms state-of-the-art methods and show effective performance in CCAD task.
All components play important roles to improve performance of LogAction.
LogAction demonstrates relatively stable performance when the param fluctuates.
We use t-SNE to visualize data distributions of logs before and after encoding. As shown in figure, blue/red represent normal/anomalous logs, and triangles/circles denote source/target systems. Before encoding, source and target logs (normal/anomalous) form separate clusters, showing distinct distributions. After encoding, clusters of both systems' normal and anomalous logs converge, indicating reduced distribution gaps and improved alignment.